
I am a final-year Data Science and Informatics student at the University of Zimbabwe, dedicated to uncovering actionable insights from complex datasets. My expertise lies at the intersection of statistical analysis, predictive modeling, and business intelligence.
Currently, I am leveraging my analytical skills at OK Zimbabwe Limited, where I focus on optimizing retail operations and enhancing customer experience through data-driven strategies. I am passionate about transforming raw retail data into high-impact business value.
 Python
 SQL
SQL Pandas
 NumPy
NumPy Power BI
 Excel
Excel
 Tableau
 Git
Git HTML
HTML CSS
CSSEducation is the passport to the future, for tomorrow belongs to those who prepare for it today.

WorldQuant University | USA

National University of Science & Technology | NUST

Midlands State University | MSU

Centre for Development Studies | CDS

Problem: Identifying different customer groups was difficult when looking at large spreadsheets manually.
Work: Cleaned the data and used DBSCAN to group customers based on how much and how often they spend.
Tools: Python, Pandas, Scikit-learn, Matplotlib
Outcome: Visualized clear segments, making it easier to see different customer spending habits.

Problem: Sales numbers in the system sometimes didn't match up with the branch transaction records.
Work: Used SQL and Excel to build checks that find mismatches and automate the monthly reporting process.
Tools: SQL, Excel, Power BI
Outcome: Helped identify errors faster and ensured more accurate data for financial reports.
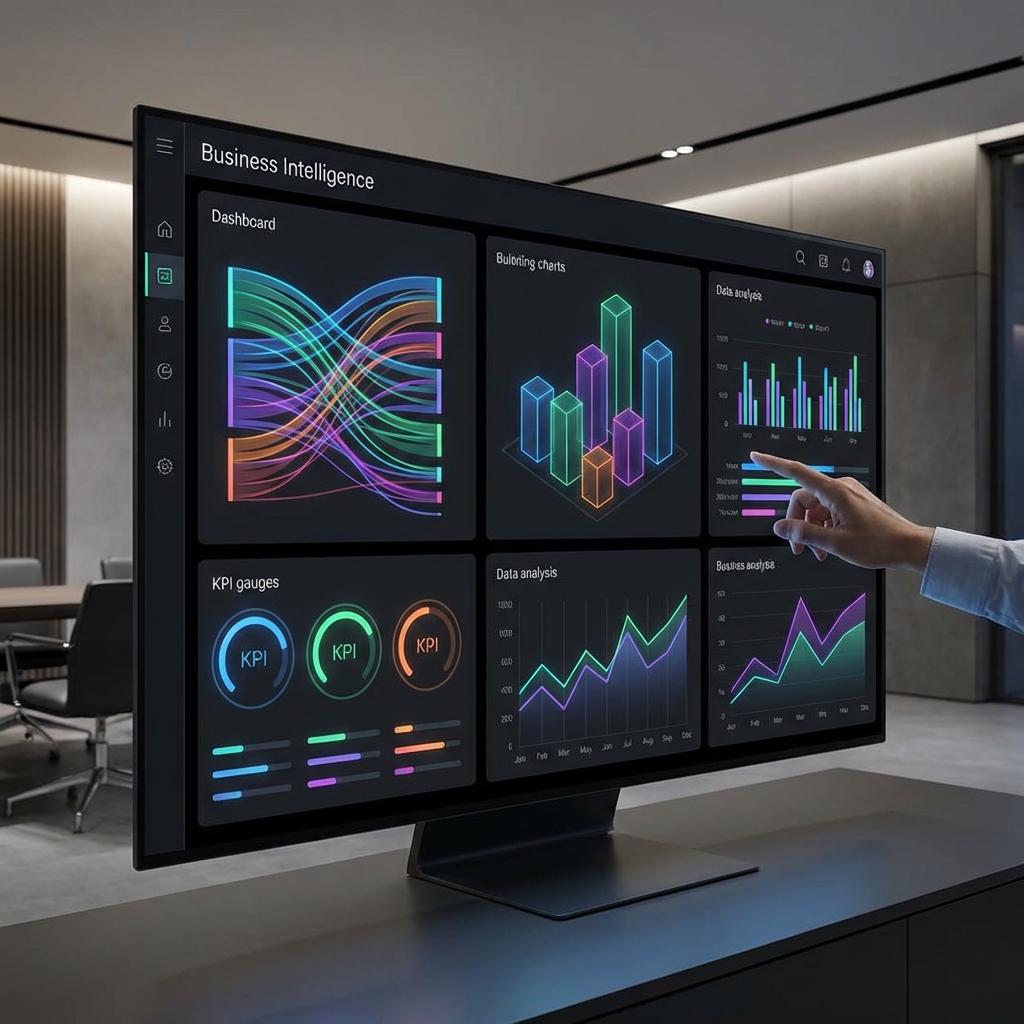
Problem: Monthly sales reports were slow to prepare and hard to visualize across different regions.
Work: Cleaned raw data and built a Power BI dashboard to track weekly sales trends and best-selling categories.
Tools: Power BI, Excel
Outcome: Reduced the time needed to prepare reports and made it easier to see how each category is performing.
Note: Work performed during internship at DataVerse Africa.
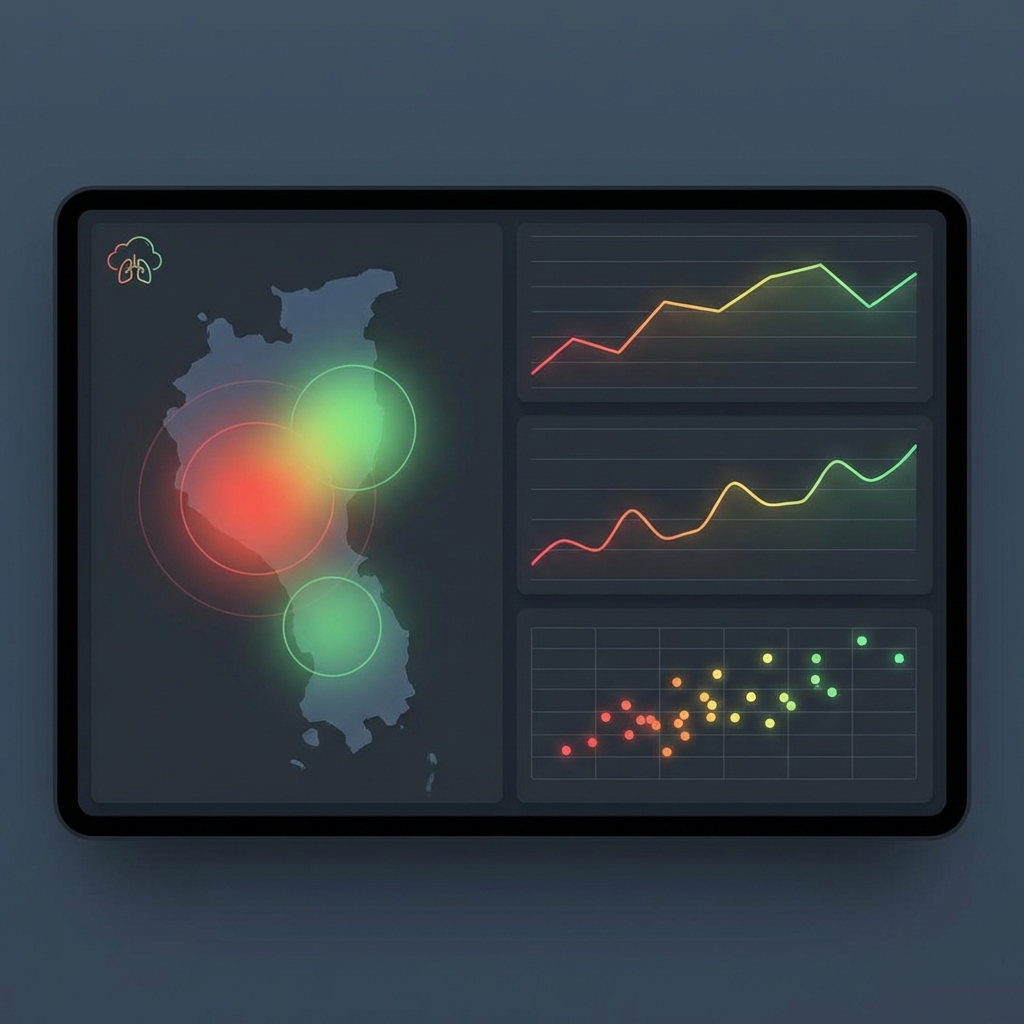
Problem: Exploring how local air quality changes correlate with public respiratory health complaints.
Work: Merged air quality records with public health numbers and plotted the results to find trends.
Tools: Python, Pandas, Matplotlib, Seaborn
Outcome: Visualized clear patterns between pollution spikes and hospital visits in specific zones.
October 2025 - Present
Applying data science and informatics expertise to solve real-world retail business challenges:
June 2018 - Dec 2024
Focused on social impact and open-source data projects: